Debug Assistance
Use the VA Memory View and the VA Step Filter included with Visual Assist to shorten the time required to debug native C/C++.
Address Resolver
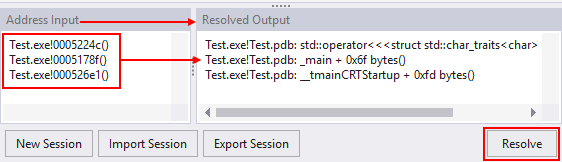
Decipher text-only addresses and call stacks.
Debug native C/C++ when debug information arrives in text form in lieu of a program dump. Address Resolver reads EXEs, DLLs, and PDBs, and finds the symbols associated with text versions of virtual addresses.
PDB Explorer
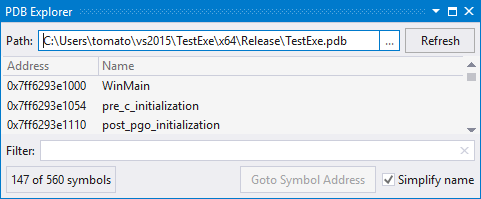
Debug native code when source is not available.
Browse and search for symbols in modules that comprise executable code, whether or not the code is in a running process. Find symbols in EXEs and DLLs as if you were finding symbols in a solution.
VA Memory View
Debug crash dumps with corrupted call stacks.
Use the VA Memory View when tracing a crash dump in which the call stack is not decipherable by Visual Studio, either due to corruption or in a release build.
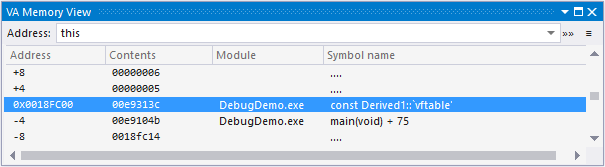
The VA Memory View displays a call stack with memory addresses pointed to and around the current stack pointer.
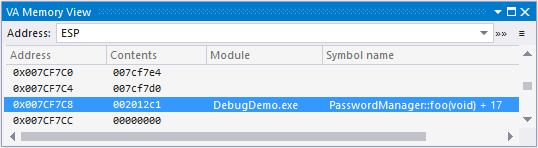
Search the VA Memory View by specific addresses.
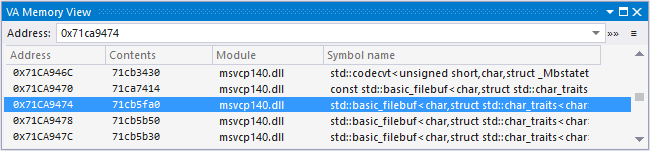
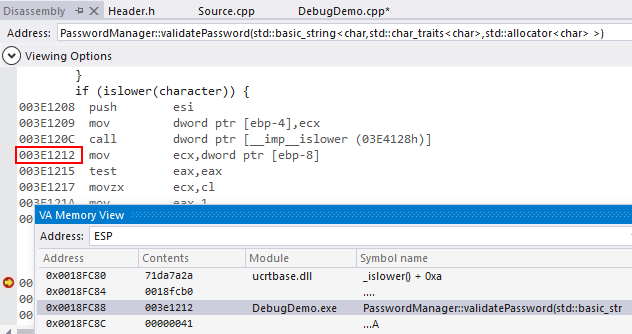
The VA Memory View also accepts more complex expressions, such as 'ESP+8' or 'this'.
Enter a disassembly view for a memory address from within the VA Memory View.
VA Step Filter
Automatically step over methods.
When stepping through native C/C++, step directly into methods without necessarily stepping into the methods of an argument list.
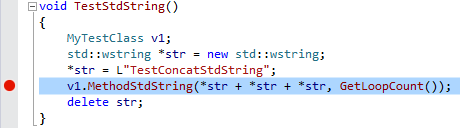
For example, step into MethodStdString() without stepping into GetLoopCount() or the string class:
Create filters for the methods you want to step over, in a tool window that opens when you start debugging.
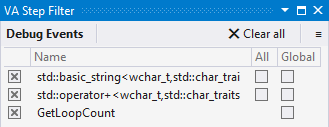
Use built-in filters to step over commonly used methods of standard libraries, including methods in the string class.
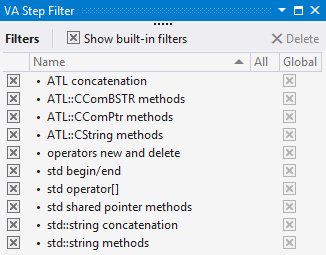
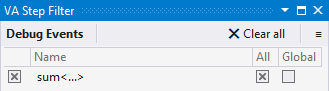
Designate filters for instantiations of function templates and methods of template classes to step over a specific type of instantiation or step over all types.
Filters apply to successive debugging sessions, can apply to all of your solutions, and can be stored in a shared directory.